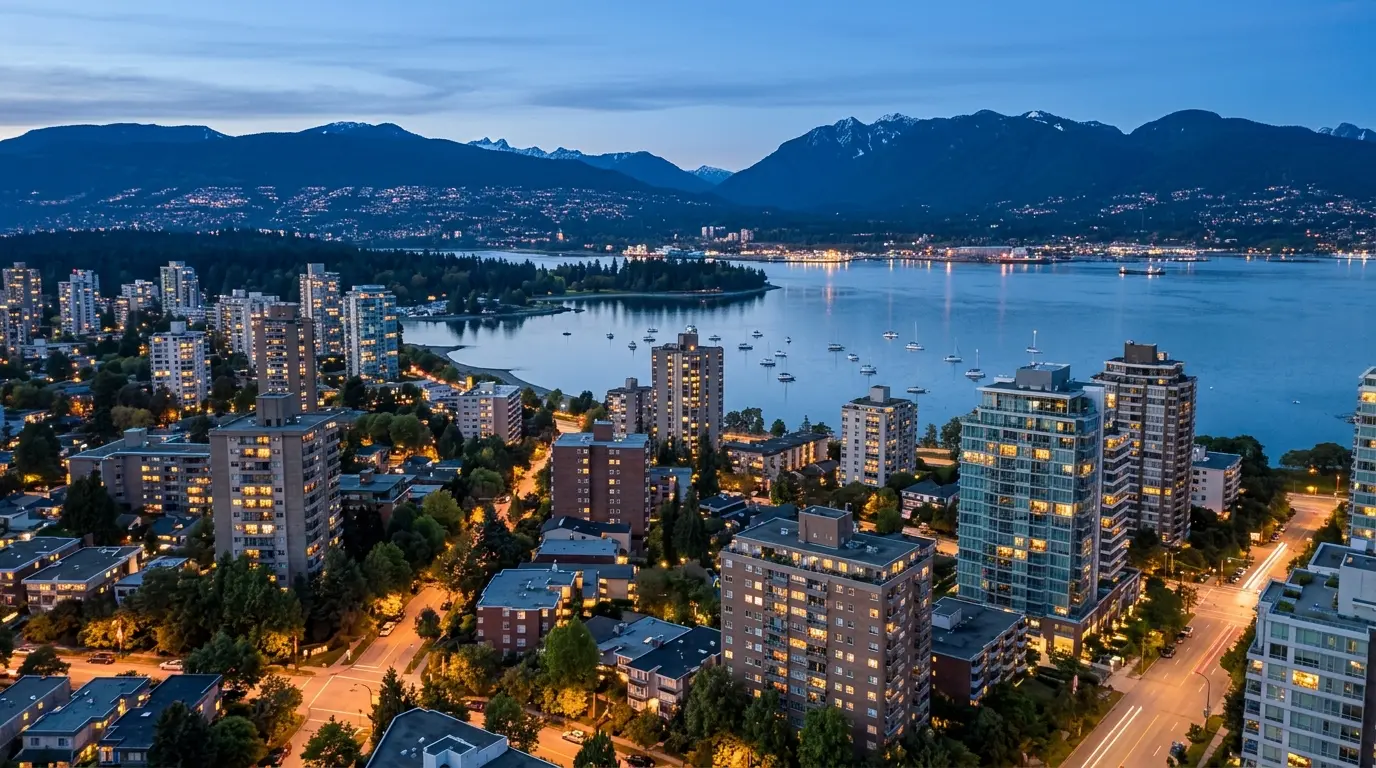
Quick answer: In June 2026, Metro Vancouver recorded 2,390 residential sales (up 9.6% year-over-year), with every property type posting gains — detached +13.7%, attached +11.4%, apartment +6.1%. Despite the broad demand recovery, the MLS HPI composite benchmark was $1,099,100 (down 6% YoY, down 0.1% MoM), as elevated inventory absorbed the demand. The overall sales-to-active-listings ratio was 14.6%, a balanced market.
For the first time in years, detached, townhouse, and condo sales all climbed year-over-year in the same month — detached led at +13.7%. Yet the composite benchmark barely moved. Here's why demand came back but prices didn't, and what it means if you're buying or selling this summer.
Want a free assessment for your property?
Leave your name and phone — Greyden will call you back with a personalized market snapshot. No spam, no drip campaigns.
Join 1,000+ Vancouver homeowners. No spam, unsubscribe anytime.
Update: my July 2026 market update is now live.
For two years I’ve opened these updates by pointing at the split — detached doing one thing, condos doing another, and the headline sales number papering over the difference. This month I can’t. In June, every home type sold more than it did a year ago.
Greater Vancouver Realtors reported 2,390 residential sales in June 2026, a 9.6% increase from the 2,181 sales a year earlier. Detached led at +13.7%, townhouses rose 11.4%, and even condos — the segment that’s been dragging all year — were up 6.1%. GVR’s own economist called it “a rare occurrence in recent years.” He’s right. For a market that’s been moving in pieces, everything pulling in the same direction is the most interesting thing that’s happened since spring.
And yet prices didn’t move. The composite benchmark slipped 0.1% on the month. That gap — demand up, prices flat — is what this whole update is about.
The June 2026 Numbers at a Glance
| Metric | June 2026 | Change |
|---|---|---|
| Total residential sales | 2,390 | +9.6% YoY |
| Composite benchmark | $1,099,100 | −6.0% YoY / −0.1% MoM |
| Detached benchmark | $1,842,900 | −7.1% YoY / −0.3% MoM |
| Townhouse benchmark | $1,046,200 | −5.0% YoY / −0.2% MoM |
| Apartment benchmark | $695,200 | −7.1% YoY / −0.4% MoM |
| New listings | 5,938 | −6.0% YoY |
| Active listings | 17,017 | −3.1% YoY |
| Sales-to-active ratio | 14.6% | Balanced |
Source: GVR June 2026 Monthly Market Report, released July 2, 2026. Sales were 12.4% below the 10-year seasonal average of 2,728.
Every Segment Went Up — That’s the Headline
Here’s the breakdown by property type, because for once the story isn’t hidden in the averages — it’s right on the surface.
| Segment | Sales (YoY) | Benchmark | YoY price | MoM price | Sales-to-active |
|---|---|---|---|---|---|
| Detached | 747 (+13.7%) | $1,842,900 | −7.1% | −0.3% | 12% |
| Townhouse | 527 (+11.4%) | $1,046,200 | −5.0% | −0.2% | 17.8% |
| Apartment | 1,103 (+6.1%) | $695,200 | −7.1% | −0.4% | 15.5% |
Source: GVR June 2026 Monthly Market Report.
Andrew Lis, GVR’s chief economist, put it this way: “June saw a pattern of broad gains in home sales across all home types relative to the same time last year, which has been a rare occurrence in recent years. June’s data could be an early sign of a shift in the market. In recent years, sales trends have usually been mixed across home types, which is typical of a sideways trending market. But with all housing types posting gains in June, the data indicate demand may be returning to the market more broadly.”
I want to be careful here, because one broad month is not a trend. But I’ve felt this on the ground. Open houses that drew three groups in April drew eight or nine in June. I had a detached listing near Dunbar that sat quietly through spring and then took two offers in the same week once the weather turned. Nothing frantic — no bidding wars back to 2021 levels — but the foot traffic is real, and it’s across the board, not just the cheap end.
The thing that would make me call it a genuine turn is prices following sales. They haven’t yet. Which brings us to the number I actually watch.
What the Sales-to-Active Ratio Actually Tells You
The sales-to-active-listings ratio is the metric I trust most, because it leads price by a month or two. GVR’s own rule of thumb: below 12% for a sustained stretch and prices tend to soften; above 20% and they tend to rise; in between is the sideways zone. In June the overall ratio was 14.6% — comfortably balanced, the range where prices mostly drift.
Look at how it’s shifted by segment, though. Detached climbed to exactly 12% in June, up from 10.7% in May — it’s just crossed off the soft-pricing line for the first time in months. Townhouses at 17.8% are the tightest of the three, and apartments sit at 15.5%. A year ago detached was the weak link on this measure; now it’s firming faster than anything else, which lines up with those +13.7% sales.
Here’s the honest read: a 14.6% overall ratio and flat month-over-month prices are exactly consistent. Demand is strong enough to stop the slide, not strong enough to reverse it. If the ratio pushes toward 18-20% and holds, that’s when I’d expect the benchmark to start ticking up. We’re not there.
Inventory Is Still the Story — But It Stopped Climbing
For a year, the answer to “why aren’t prices rising?” has been the same: too many homes for sale. That’s still true. There were 17,017 properties listed at the end of June, about 30.2% above the 10-year seasonal average. That’s a lot of selection, and it’s the ceiling on prices right now.
But two things underneath that number changed. Active listings are actually down 3.1% from a year ago, and new listings came in at 5,938 — 6% below last June. So sellers aren’t piling in, and the standing inventory has stopped growing.
That’s the mechanism to watch this summer. Rising demand alone doesn’t move prices. Rising demand plus falling inventory does. June was the first month both halves started pointing the same way — but “started” is the operative word. For buyers, it means the window of easy leverage is still open, just not as wide as it was in the spring.
The Rate Backdrop
Money isn’t the constraint right now — supply and confidence are. The Bank of Canada held its policy rate at 2.25% on June 10, 2026, where it’s sat since December 2025. The Bank Rate is 2.5%, and the Bank pointed to weak Canadian economic activity, ongoing US trade-policy uncertainty, and elevated oil prices from the Middle East conflict as reasons to stay put. The next decision lands July 15, 2026. I wrote more about what a steady rate does to Vancouver borrowing power in my note on the Bank of Canada’s rate hold.
The practical takeaway hasn’t changed: a 2.25% policy rate keeps fixed mortgage rates in a band buyers can actually plan around. It’s not stimulus, but it’s not the headwind it was in 2023-24. If June’s demand pickup has a driver, it’s less about a rate move and more about buyers who’ve waited two years deciding the bottom is close enough to act — which, notably, is a decision people make once inventory stops falling out from under prices.
For Buyers: The Window’s Still Open, But It’s Narrowing
If you’ve been waiting, June is the first month I’d point to and say the tide might be turning. Not turned — turning. You still have 17,000 listings to choose from and a 14.6% ratio that keeps you in a negotiating position. But detached just crossed back to 12% on the sales-to-active measure, and if you’re shopping the west side — Kitsilano, Dunbar, Point Grey — you’re now competing with more buyers than you were in April.
My advice is the same as it’s been all year, just with more urgency behind it: bid on the specific property, not the market narrative. The condo segment still gives you the most room — 15.5% ratio, benchmark off 7.1% from last year — so if you’re after an apartment, take your time on strata due diligence and make the offer the seller doesn’t want to lose. But don’t sit on a detached home you love waiting for a lower print that the June data says probably isn’t coming.
For Sellers: More Buyers Showed Up — They Didn’t Pay More
This is the nuance that trips people up. Yes, sales rose almost 10%. No, that does not mean you can raise your price. The composite benchmark is still down 6% year-over-year and slipped again month-over-month. More buyers walked through in June, but they paid to the comparables that closed in May, not to what your neighbour got in 2024.
So the strategy is: price to the live comparables, present the home properly, and let the improved foot traffic do the work. A well-priced detached listing is genuinely moving right now — I’ve seen it. An overpriced one still sits, collects days-on-market, and ends up chasing the market down with reductions. Start with a real home valuation and price for the June market, not the one you remember.
Looking Ahead to July
Two things I’m watching. First, the Bank of Canada’s July 15 decision — another hold is widely expected, which keeps the calm rate backdrop in place. Second, and more important, whether Lis’s inventory-reversal thesis actually shows up in the July numbers. If new listings keep coming in below last year and active inventory keeps easing while sales hold up, that’s the setup that finally puts a floor under prices. If inventory ticks back up instead, we’re right back in the sideways market.
My honest read: June was the most encouraging single month for demand in a while, but I’ve been doing this 20 years and I know better than to call a summer bounce a bottom. I think we’re in the early innings of inventory tightening, and I could be wrong — one broad month doesn’t make a trend. The buyers who do best from here won’t wait for a market-wide all-clear that rarely comes; they’ll move on the right property while there’s still selection.
Key Takeaways
- Metro Vancouver recorded 2,390 sales in June 2026 (+9.6% YoY), still about 12.4% below the 10-year seasonal average.
- Every home type gained: detached sales +13.7%, townhouse +11.4%, apartment +6.1% — the first broad-based month in years.
- The composite benchmark is $1,099,100 — down 6% year-over-year and down 0.1% from May. Demand rose; prices didn’t.
- Detached firmed up: benchmark $1,842,900, and its sales-to-active ratio hit 12%, up from 10.7% in May.
- Inventory is elevated but no longer climbing: 17,017 active listings (30.2% above the 10-year norm) yet down 3.1% YoY, with new listings off 6%.
- The Bank of Canada held at 2.25% on June 10, 2026; next decision July 15. Borrowing cost is not the constraint.
- It’s a balanced market (14.6% ratio) — buyers still have leverage but the window is narrowing; sellers should price to comparables, not to 2024.
Frequently Asked Questions
What was the Vancouver composite benchmark price in June 2026?
The MLS Home Price Index composite benchmark for Metro Vancouver was $1,099,100 in June 2026, down 6% year-over-year and down 0.1% from May, according to Greater Vancouver Realtors.
Are Vancouver home sales rising or falling in June 2026?
Rising across every segment. Total residential sales reached 2,390 in June 2026, up 9.6% year-over-year, with detached sales up 13.7%, attached up 11.4%, and apartment up 6.1% — the first time in recent years all three home types posted gains in the same month.
What is the Bank of Canada’s policy rate as of June 2026?
The Bank of Canada held its policy rate at 2.25% on June 10, 2026, unchanged since December 2025. The Bank Rate is 2.5% and the next decision is scheduled for July 15, 2026.
Is the Vancouver market a buyer’s or seller’s market right now?
Balanced. The overall sales-to-active-listings ratio was 14.6% in June 2026 — above the 12% soft-pricing line but well below the 20% level that pushes prices up. With inventory 30.2% above the 10-year average, buyers still have selection and negotiating room.
Why aren’t Vancouver home prices rising if sales are up?
Because inventory is large enough to absorb the extra demand. There were 17,017 active listings in June 2026 — 30.2% above the 10-year seasonal average. GVR economist Andrew Lis notes prices typically rise only when demand climbs and inventory falls; so far demand is up but standing inventory is only just starting to level off.
How much inventory is on the Vancouver market right now?
There were 17,017 active listings in Metro Vancouver at the end of June 2026, about 30.2% above the 10-year seasonal average but down 3.1% from a year ago. New listings also fell 6% year-over-year, an early sign the inventory build-up may be slowing.
Sources
- Greater Vancouver Realtors — June 2026 Monthly Market Report
- Bank of Canada — Policy Interest Rate Decision, June 10, 2026
- Previous update: May 2026 Vancouver Market Update
Data sourced from the GVR June 2026 release (July 2, 2026). Market conditions change monthly — verify current figures before making decisions. This is general market analysis, not financial advice.
Related Vancouver guides:
- BC Property Transfer Tax Calculator 2026 — enter your purchase price, see the exact tax and any first-time-buyer or new-build exemption
- Most affordable Vancouver neighbourhoods in 2026 — where condos under $600K and homes under $1.5M still exist
- BC real estate commission calculator — if you’re selling this summer, see your fees and net proceeds
- Best Vancouver neighbourhoods for investors — where the rental math and appreciation potential still line up
Let’s Talk About Your Specific Situation
Averages don’t buy or sell houses — specific decisions about specific properties do. June’s numbers are encouraging, but the right question isn’t “is the market turning,” it’s “what does this mean for my building, my street, my timeline.” That’s the conversation I have every day. Start with a no-pressure home valuation if you’re thinking of selling, or just tell me what you’re trying to do.
Contact Greyden Douglas directly at (604) 218-2289 or book a call to discuss your Vancouver real estate goals.
Frequently asked questions
What was the Vancouver composite benchmark price in June 2026?
The MLS Home Price Index composite benchmark for Metro Vancouver was $1,099,100 in June 2026, down 6% year-over-year and down 0.1% from May, according to Greater Vancouver Realtors.
Are Vancouver home sales rising or falling in June 2026?
Rising across every segment. Total residential sales reached 2,390 in June 2026, up 9.6% year-over-year, with detached sales up 13.7%, attached up 11.4%, and apartment up 6.1% — the first time in recent years all three home types posted gains in the same month.
What is the Bank of Canada's policy rate as of June 2026?
The Bank of Canada held its policy rate at 2.25% on June 10, 2026, unchanged since December 2025. The Bank Rate is 2.5% and the next decision is scheduled for July 15, 2026.
Is the Vancouver market a buyer's or seller's market right now?
Balanced. The overall sales-to-active-listings ratio was 14.6% in June 2026 — above the 12% soft-pricing line but well below the 20% level that pushes prices up. With inventory 30.2% above the 10-year average, buyers still have selection and negotiating room.
Why aren't Vancouver home prices rising if sales are up?
Because inventory is large enough to absorb the extra demand. There were 17,017 active listings in June 2026 — 30.2% above the 10-year seasonal average. GVR economist Andrew Lis notes prices typically rise only when demand climbs and inventory falls; so far demand is up but standing inventory is only just starting to level off.
How much inventory is on the Vancouver market right now?
There were 17,017 active listings in Metro Vancouver at the end of June 2026, about 30.2% above the 10-year seasonal average but down 3.1% from a year ago. New listings also fell 6% year-over-year, an early sign the inventory build-up may be slowing.
Sources
- Greater Vancouver Realtors — June 2026 Monthly Market Report · industry · accessed 2026-07-04
- Bank of Canada — Policy Interest Rate Decision (June 10, 2026) · government · accessed 2026-07-04
- BCREA 2026 H2 Housing Forecast · industry · accessed 2026-07-04
Related Vancouver real estate pages
Continue with local service pages, neighbourhood guides, and actionable resources related to this topic.